https://api-prod.weenat.com
Weenat Developers' API V3
Full reference documentation for integrating Weenat sensor data into your own applications and workflows.
Quickstart
New to the Weenat API? This guide walks you through your first API call in a few minutes — no prior Weenat knowledge required. Whether you're a developer, a project manager, or just curious about what's possible, you'll have live sensor data in front of you by the end.
Sign in to the Weenat app and generate a personal API key. Keys are user-based — one key gives you access to all the farms and networks you belong to.
- Sign in at app.weenat.com
- Go to My account → Account management → API
- Click Create a key, name it, and copy it somewhere safe — it won't be shown again.
Every API request must include your key in the Authorization header:
Authorization: Weenat-Api-Key <your-api-key>You can also try all endpoints interactively via the V3 Swagger UI — click Authorize and paste your key there. No code needed.
Call GET /v3/devices to retrieve all sensors you have access to. This is the best starting point — it gives you device IDs, models, available metrics, and their last known location.
curl https://api-prod.weenat.com/v3/devices \
-H "Authorization: Weenat-Api-Key <your-api-key>"The response is a paginated list. Here's what a single device entry looks like:
{
  "count": 123,
  "next": "https://api-prod.weenat.com/v3/devices/?offset=100&limit=100",
  "previous": null,
  "results": [{
    "id": 17892,
    "brand": "Weenat",
    "serial_number": "W700349",
    "model": "CAPA-60-6",
    "model_label": "Soil capacitance probe",
    "sensor_brand": "HydrWize",
    "available_metrics": ["T_CAPA", "U_CAPA"],
    "registered_by": {
      "id": 1484,
      "name": "Atlantic Cooperative"
    },
    "location": [47.01407, -2.28703],
    "location_text": "Noirmoutier-en-l'Île, Vendée",
    "broadcast_network_provider": "LoRa",
    "latest_measurement_broadcast": "2024-07-24T09:21:40Z",
    "timezone": "Europe/Paris"
  }]
}Note the id field — you'll need it for the next step. The available_metrics array tells you exactly what this sensor measures.
Use the device id from the previous step to call GET /v3/data/devices/{id}. You must specify a timespan and a time range.
curl "https://api-prod.weenat.com/v3/data/devices/17892?timespan=hour&begin=2024-07-24T00:00:00Z&end=2024-07-24T23:59:59Z" \
-H "Authorization: Weenat-Api-Key <your-api-key>"| Parameter | Values | Description |
|---|---|---|
| timespan | raw hour day | Granularity of the returned data |
| begin | ISO 8601 UTC | Start of the requested period |
| end | ISO 8601 UTC | End of the requested period |
raw → 15 days · hour → 35 days · day → 370 days. See Rate limits for full details.
Introduction
We are glad to introduce you the Weenat Developers API. We work hard to let you handle your own data the way you want and cover more use cases than the ones you can enjoy in our web and mobile apps.
Who is it made for?
We've made the Weenat Developers API for organizations that dispose of development capacities and can rely on one or more developers.
It can also be used by people using AI platforms and willing to exploit the full potential of this API.
Prerequisites
In order to use the Weenat Developers API, you will need:
- A Weenat App account - Create it here
- A Weenat Developers API key — Create it here
- It can be someone else's API key or yours. But if it's yours, you have to be a member of the farms or networks of farms from which you want to retrieve data.
Basic Principles
- All calls must be done on base URL:
https://api-prod.weenat.com - All values must be encoded in
UTF-8. - Time is represented using ISO 8601 timestamps such as:
2024-12-10T09:04:34Z - Timestamps are expressed in UTC (Z). Not in local time.
- Main concepts:
farms,plots,devices,data. - All data uses the metric system. Imperial conversions must be done on your side.
- Positions use
latitudeandlongitude[lat, long] coordinates. Some old sensors do not provide coordinates. However, geojson attributes are in MKT standard: [long, lat].
- Farms can be nested (a farm can the parent farm of other farms, in networks for example).
- Some devices may not be related to a plot. They can be standalone. Some devices may be related to several plots. Tensiometers can be virtually installed at different depths in different plots.
- Not all farms have plots. It is not mandatory.
- Not all farms have sensors. It is not mandatory.
- Farms may have virtual sensors.
- Some devices do not expose data. For example if they're broken, have a battery failure or are laid down. It can also be a destroyed sensor that haven't been removed from the farm it belonged to.
- Members of farms being affiliates of a network may have access to a lot of sensors (sensors belonging to the network (parent farm or affiliate farms)).
- Not all networks share the sensors between affiliates.
Authentication & API Keys
The API relies on API keys for authentication. Generate one in the app:
- Sign in at app.weenat.com/auth/login
- Go to My account
- Navigate to Account management → API
- Click Create a key, give it a name, and save.
Authorization: Weenat-Api-Key <your-api-key>
Key rules
- API keys are user-based, not farm-based, nor network-based. One key can access all farms, plots and sensors one can have access to.
- Keys have no duration limit.
- Once deleted, the key is immediately invalidated.
- You can create up to 20 keys.
- API limits are per user, shared across all your keys. - View limits
- If you want to take the most advantage of the API keys limits, ask a member in each one of the farms from which you want to retrieve data to give you a key.
What can you do with it?
You can retrieve the list of affiliate farms of a network.
You can retrieve the detailed information of a farm. Whether is it an independant farm or an affiliate of a network.
You can retrieve a list of plots.
You can retrieve a list of sensors.
You can scope the list of plots per farm.
You can scope the list of sensors per farm.
You can retrieve details of a sensor per serial number.
For each plot or sensor, you can retrieve data (measurements).
The data can be retrieved at a specific timespan for a specific period.
At plot level, you always have more data because Weenat adds more metrics and several sensors can be linked to a plot.
Depending if you fetch data at plot level or sensor level, the metric name can change. Ex: T_CAL-20 at sensor level can be named T_SOIL_BY_HORIZON-20 at plot level.
Each "data" is a timestamped dataset representing a point in the history of your plot/sensor. Example:
{
  "timestamp": "2024-12-10T09:04:34Z",
  "T":   35.1,
  "U":   59.2,
  "RR":  0,
  "FF":  2.6,
  "FXY": 11.3
}By cumulating timestamps you can rebuild a data table, convert it into a graph, understand the current situation, and make projections.
Metrics Reference
All measurements you may find in API responses:
| Key | Definition |
|---|---|
| T | Temperature (°C) |
| U | Relative humidity (%) |
| RR | Cumulative rainfall (mm) |
| FF | Wind speed (km/h) |
| DD | Wind direction (degrees; e.g. 90° for a wind from the east) |
| FXY | Wind gust speed (km/h) |
| DXY | Wind gust direction (degrees) |
| T_SOIL | Soil temperature from Soil thermometers or Fertigation probes (°C) |
| T_SOIL_BY_HORIZON-20… | Soil temperature at 20 cm, 30 cm… from Tensiometers or Capacitive probes (°C) at plot level |
| T_CAL-20, T_CAL-30… | Soil temperature at 20 cm, 30 cm… from tensiometers (°C) at plot level |
| T_CAL | Tensiometer soil temperature (°C) at sensor level |
| HPOT-20, HPOT-30… | Hydric potential at 20 cm, 30 cm… (kPa) at plot level |
| HPOT | Tensiometer hydric potential (kPa) at sensor level |
| T_CAPA-20, T_CAPA-30… | Soil temperature at 20 cm, 30 cm… from capacitive probes (°C) |
| U_CAPA-20, U_CAPA-30… | Soil water content at 20 cm, 30 cm… (%) |
| SF_CAPA-20, SF_CAPA-30… | Scale frequency at 20 cm, 30 cm… (no unit) |
| T_DRY | Dry temperature (°C) |
| T_WET | Wet temperature (°C) |
| LW_D | Leaf wetness duration (s) |
| LW_V | Leaf wetness voltage (mV) |
| ECP | Electro-conductivity (dS/m) |
| SWC | Soil water content (%) |
| SSI | Solar irradiance (W/m²) |
| SSI_MIN | Minimum solar irradiance (W/m²) |
| SSI_MAX | Maximum solar irradiance (W/m²) |
| PPFD | Photosynthetically active radiation (µmol/s/m²) |
| PPFD_MIN | Minimum PAR (µmol/s/m²) |
| PPFD_MAX | Maximum PAR (µmol/s/m²) |
| T_DEW | Dew point (°C) |
| ETP | Potential evapotranspiration (mm) |
| VPD | Vapor Pressure Deficit (kPa) |
| THI | Temperature Humidity Index (animal comfort temperature index) |
| READILY_WATER_CONTENT-40… | Readily available water at 40 cm… (mm) |
| SURVIVAL_WATER_TANK-40… | Survival water tank at 40 cm… (mm) |
| WATER_TANK_LEVEL-40… | Water tank level at 40 cm… (mm) |
| WATER_TANK_MAX-40… | Maximum water tank size at 40 cm… (mm) |
Sensor Model Names
Both name and type are exposed in API responses.
Weenat sensors
| Model name | Sensor type | Measured metrics |
|---|---|---|
| CAPA-30-3 | Soil capacitance probe | SF_CAPA-xx, T_CAPA-xx |
| CAPA-60-6 | Soil capacitance probe | SF_CAPA-xx, T_CAPA-xx |
| CHP-15/30 | Tensiometer | H_POT-xx, T_CAL-xx |
| CHP-30/60 | Tensiometer | H_POT-xx, T_CAL-xx |
| CHP-60/90 | Tensiometer | H_POT-xx, T_CAL-xx |
| EC | Fertigation probe | SWC, ECP, T_SOIL |
| LWS | Leaf wetness sensor | LW_D, LW_V |
| P | Pluviometer | RR |
| PT | Weather station | RR, T |
| P+ | Weather station | RR, T, U |
| SMV | Virtual weather station | RR, T, U |
| SMV+ | Virtual weather station & anemometer | RR, T, U, FF, DD, FXY, DXY |
| PYRANO | Pyranometer | SSI, SSI_MIN, SSI_MAX |
| PAR | Photosynthetically active radiation sensor | PPFD, PPFD_MIN, PPFD_MAX |
| T_GEL | Frost sensor | T_WET, T_DRY |
| TH | Thermometer & Hygrometer | T, U |
| T_MINI | Soil thermometer | T_SOIL |
| W | Anemometer | FF, DD, FXY, DXY |
CoRHIZE sensors
| Model name | Sensor type |
|---|---|
| Aqualink-CAPA-20-2 … Aqualink-CAPA-140-14 | CoRHIZE Aqualink Soil capacitance probe |
| Corpus-CAPA-20-2 … Corpus-CAPA-80-8 | CoRHIZE EVVOS Soil capacitance probe |
| Corpus-WS | CoRHIZE EVVOS Weather Station |
| Corpus-WS-CAPA-20-2 … Corpus-WS-CAPA-80-8 | CoRHIZE EVVOS Weather Station & Soil capacitance probe |
Ongoing fault events
Both ongoing fault events name and type are exposed in API responses. The timestamp is the moment when the event started.
Ongoing fault events are only exposed on Weenat sensors, not the other brands.
Events which are over are not exposed in the response.
The events exposed are those ongoing at the time of the call. A call a few seconds later may change the response.
By default, the with_ongoing_fault_events query param is not set and results do not contain the ongoing_fault_events[] array. By setting it to 'true', the response will filter devices with ongoing fault events.
No ongoing_fault_events on SMV or SMV+.
| Event id | Event name | Event description |
|---|---|---|
| 0 | sensor_laid_down | The sensor seems to be laid down. On purpose or not. If it's not on purpose it may affect measurements. For example, a pluviometer not in a vertical position may not measure rain correctly. |
| 1 | gps_position_unknown | The sensor cannot be geolocated. This could be due to various reasons. |
| 2 | blocked_spoon | The sensor rainfall spoon cannot go back up. The most probable reason is that there are debris in the pluviometer. By cleaning the spoon and/or the pluviometer funnel, the event may stop. |
| 3 | blocked_spoon_10_times | The sensor spoon has been blocked ten times over a short period of time. The rain spoon probably needs to be changed. |
| 4 | unblocked_spoon | The spoon is no longer blocked. |
| 5 | low_signal_quality | The sensor broadcasts messages but not all messages go through the network. The two main actions to take are: moving the sensor elsewhere or adding an antenna extension. |
| 6 | interrupted_broadcast | The sensor no longer emits. The most probable reason is that the battery is dead. |
Soil Texture Types
We use USDA soil texture classes, exposed in /plots and /plots/{id} responses as an ID only. Use this table to map them:
| ID | Soil texture |
|---|---|
| 1 | Clay |
| 2 | Silty clay |
| 3 | Fine silty clay |
| 4 | Clayey-sandy |
| 5 | Sandy clay loam |
| 6 | Clay loam |
| 7 | Silt |
| 8 | Fine silt |
| 9 | Loam |
| 10 | Sand |
| 11 | Loamy sand |
| 12 | Sandy loam |
Why are metrics different between /data/devices/id and /data/plots/id?
At plot level, we have more information than at device level: soil texture, environment (open field or greenhouse), substrate type (for fertigation probes).
One of the most required metrics is U_CAPA at device level. We cannot provide it at device level because a sensor can be related to more than one plot, and each plot can have a different soil texture (and a different calibration equation (selector in the plot context panel)).
We manufacture sensors with two capacitance probe brands: HSTI (exposed as "HydrWize") and Aquacheck (exposed as "AquaChck"). Fetch the probe brand from the /plots response.
Equation
Where Y = U_CAPA (soil water content, the target value) and x = SF_CAPA (from /data/devices/{id}).
HSTI — HydrWize probes
| Calibration equation | α | β |
|---|---|---|
| Sand | -10.836 | 0.4853 |
| Sandy loam or Loamy sand | 11.107 | 0.2072 |
| Sandy clay loam | 9.2507 | 0.21885 |
| Sandy clay | 7.3944 | 0.2305 |
| Clay / Silty clay / Clay loam / Silty clay loam | -14.891 | 0.5052 |
| Loam / Silt / Silt loam | -1.892 | 0.3562 |
| Generic (all other equations) | 3.4664 | 0.2689 |
Aquacheck — AquaChck probes
| Calibration equation | α | β |
|---|---|---|
| Sand | -8.6463 | 0.5219 |
| Clay | -5.9575 | 0.6193 |
| Silt loam | -2.79 | 0.4392 |
| Loam | 4.8372 | 0.4851 |
| Clay loam | -8.4439 | 0.565 |
| Generic (all other equations) | -7.4347 | 0.5564 |
Soil Temperatures
We expose different soil temperature metrics depending on the sensor type.
T_SOIL
Temperature measured by either a Soil thermometer (T_MINI) or a Fertigation probe (EC), at the depth the sensor is installed — most of the time 5 to 10 cm deep. In the app, you cannot define any installation depth for Fertigation probes.
T_CAL-xx & T_CAPA-xx
Calibration temperatures from tensiometers and capacitive probes respectively. They are not an exact soil temperature — however, the coefficient is so small that the difference with the actual temperature is marginal.
T_SOIL_BY_HORIZON-xx
Soil temperatures from tensiometers and capacitive probes. For each horizon with multiple tensiometers, the value is the average of all tensiometers at that depth.
T_SOIL or T_SOIL_BY_HORIZON-xx on any given plot.
At data response level on /data/plots/{id}:
- If it's
T_SOIL→ source is a soil thermometer or fertigation probe. - If it's
T_SOIL_BY_HORIZON-xx→ source is a capacitive probe or one or more tensiometers.
You can cross-reference the "devices": [] array in /plots or /plots/{id} responses to confirm the sensor type.
Broadcast Timespans
Most Weenat sensors emit every 15 minutes. Some exceptions:
| Sensor | Broadcast timespan |
|---|---|
| All sensors | 15 minutes |
| Frost sensors | 15, 10 or 5 minutes (temperature-dependent) |
| Soil capacitance probes | 30 minutes |
| Virtual weather stations (SMV/SMV+) | 60 minutes (with a delay of min. 3h) |
/data/devices/{id}./data/plots/{id} exposes hourly timespans minimum, as plots aggregate sensors with different — and non-synchronized — broadcast schedules.
Leaf Wetness Intensity (LW_I)
Leaf Wetness Intensity is derived from Leaf Wetness voltage (LW_V), but as the metric by itself is difficult to analyse we applied a mapping table. 0 being dry and 10 very very wet:
| LW_V range (mV) | LW_I value |
|---|---|
| [0 – 362] | 0 |
| [362 – 416] | 1 |
| [416 – 470] | 2 |
| [470 – 525] | 3 |
| [525 – 579] | 4 |
| [579 – 633] | 5 |
| [633 – 687] | 6 |
| [687 – 742] | 7 |
| [742 – 796] | 8 |
| [796 – 850] | 9 |
| [850 – 1000] | 10 |
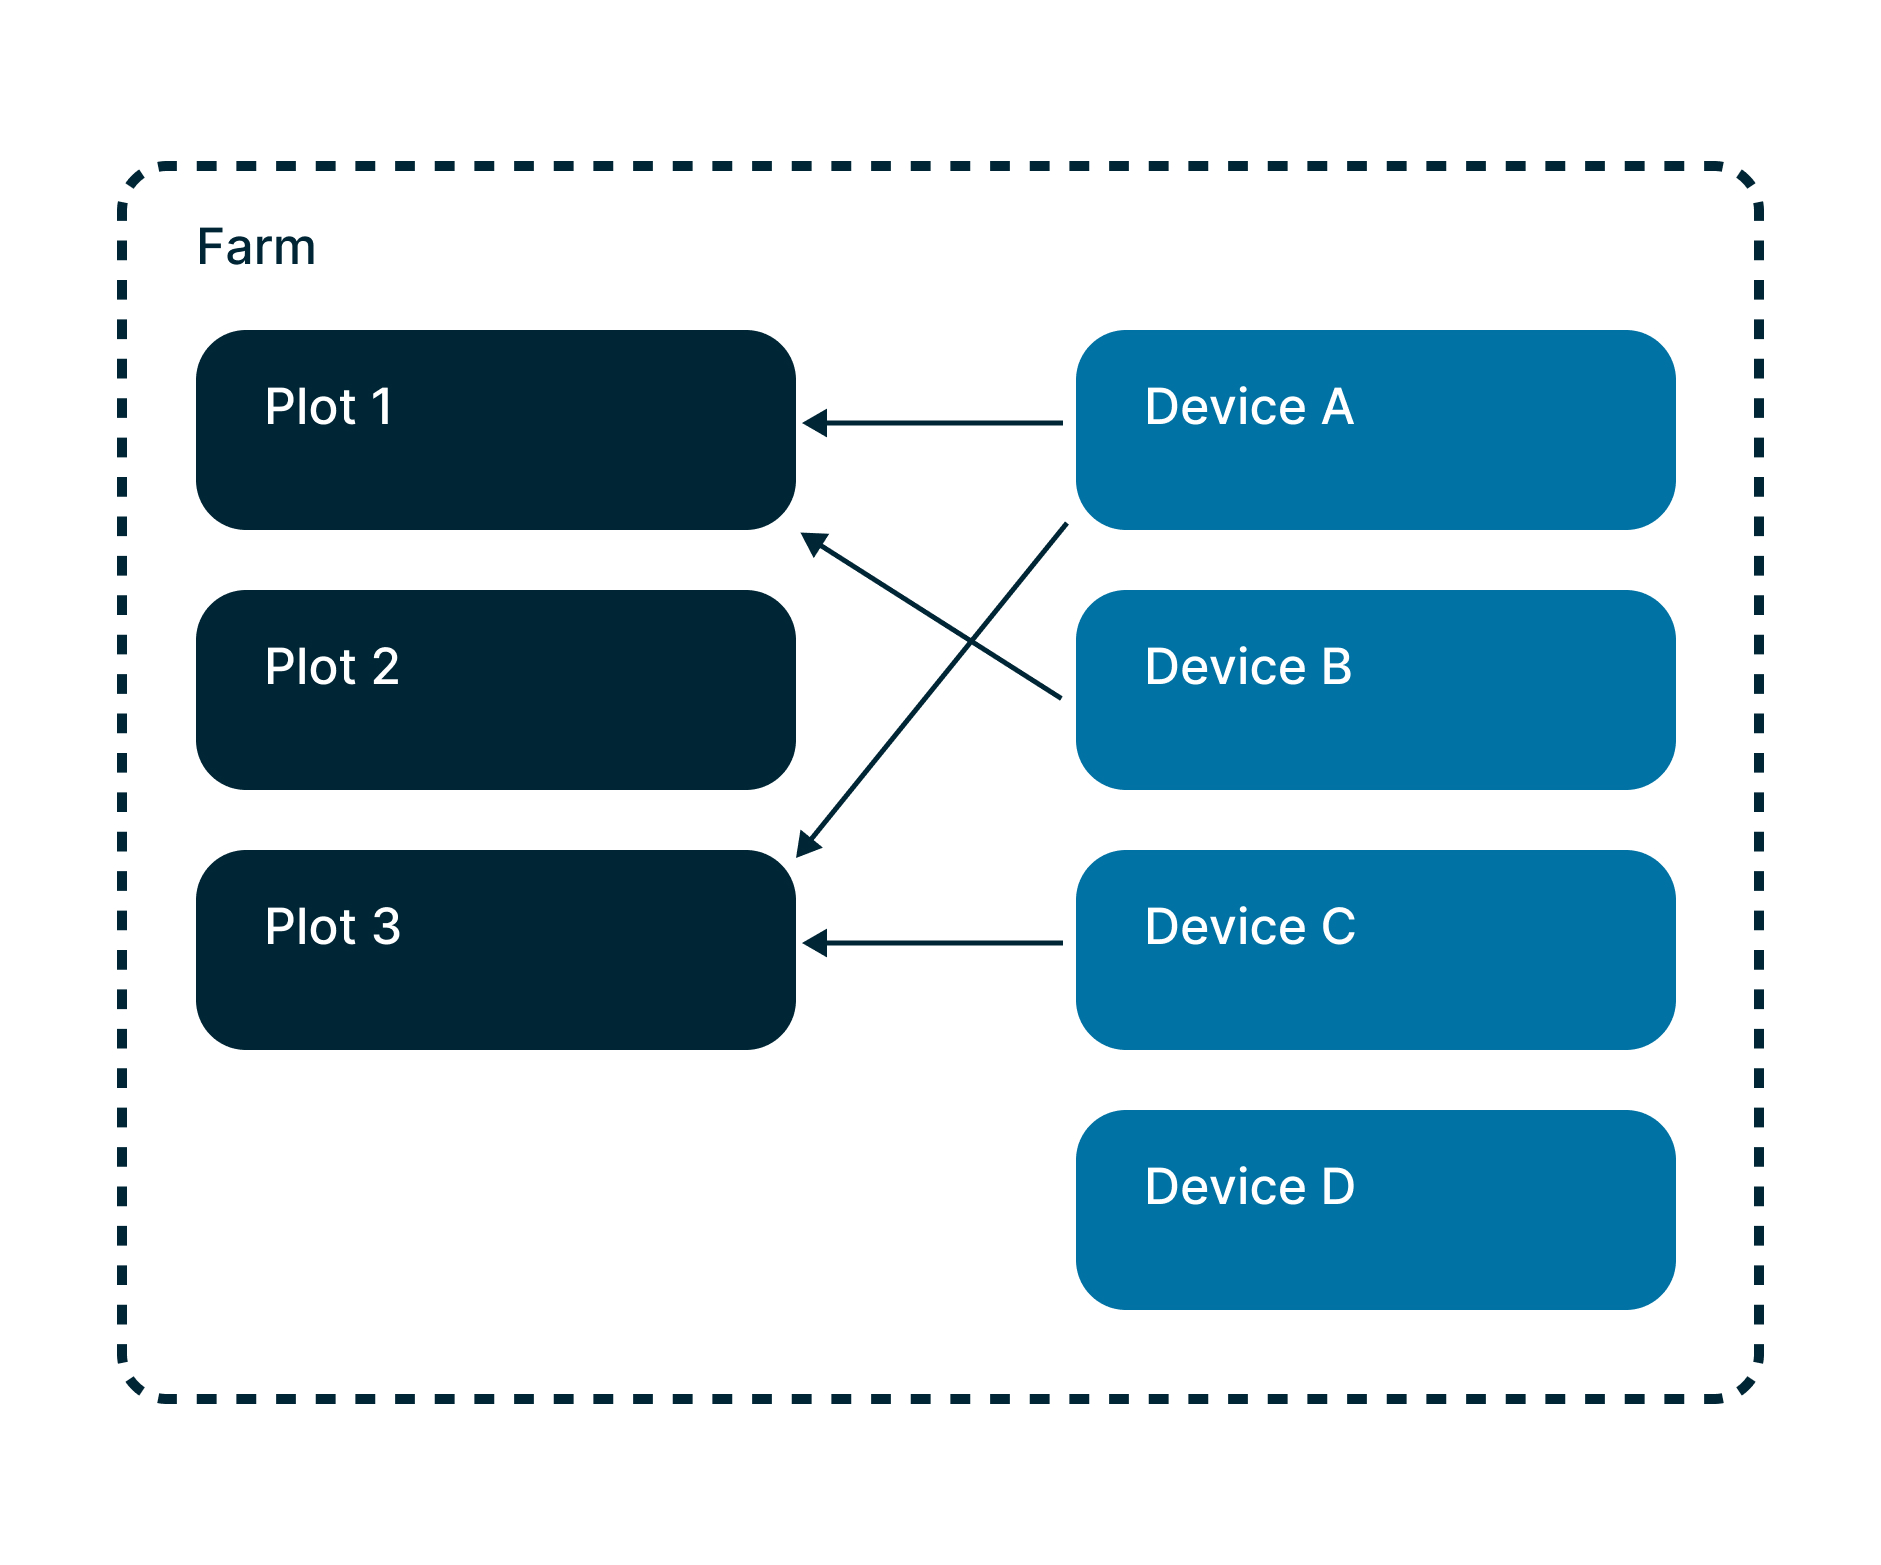
Data Model
The ultimate level of data container is a farm. A farm contains zero, one, or several plots. A device is a sensor — related to one, several, or no plot at all.
Depending on its type, each device transmits a dataset that differs in structure and timespan.
Networks & Affiliates
Both a farm and a network of farms are organizations in Weenat's database. A network can include several farms, referred to as affiliates.
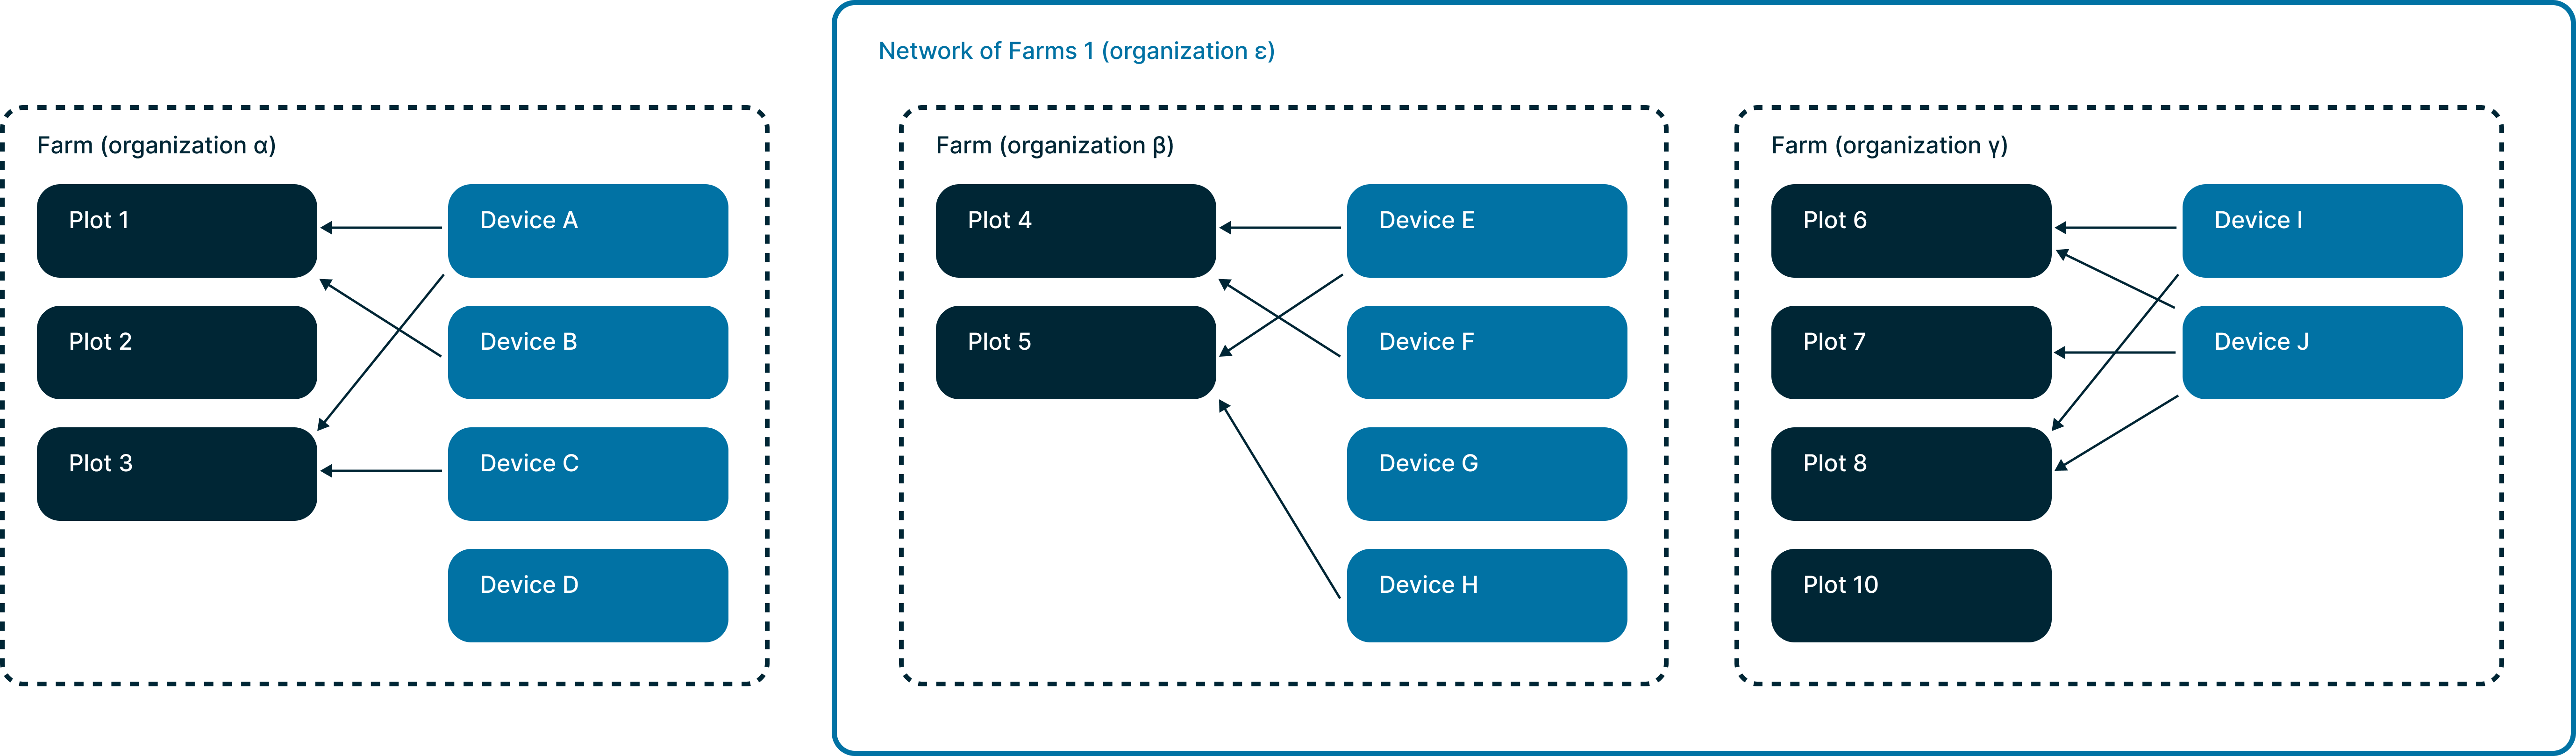
Being a member of a network gives you access to data from all affiliated farms. Being a member of a single farm restricts access to that farm only.
Specific network case: shared_sensors
Most networks are flagged shared_sensors = true (by default). Some are set to false.
shared_sensors = true (default)
The network organization and all affiliate organizations share sensors and sensor data with each other — including between affiliates themselves.
shared_sensors = false
The network shares its sensors with affiliates, and affiliates share theirs back with the network. However, affiliate organizations do not share sensors between each other.
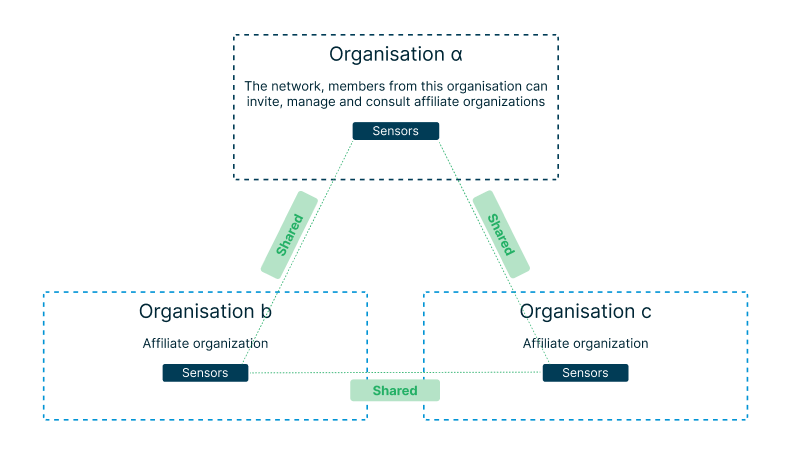
shared_sensors = true
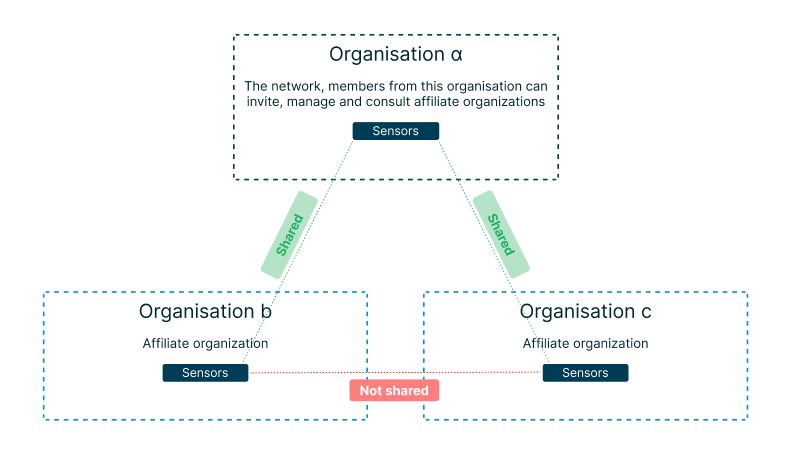
shared_sensors = false
shared_virtual_sensors = true
The network organization and all affiliate organizations share virtual sensors and virtual sensor data with each other — including between affiliates themselves.
shared_virtual_sensors = false (default)
The network & affiliates do not share virtual sensors between each other.
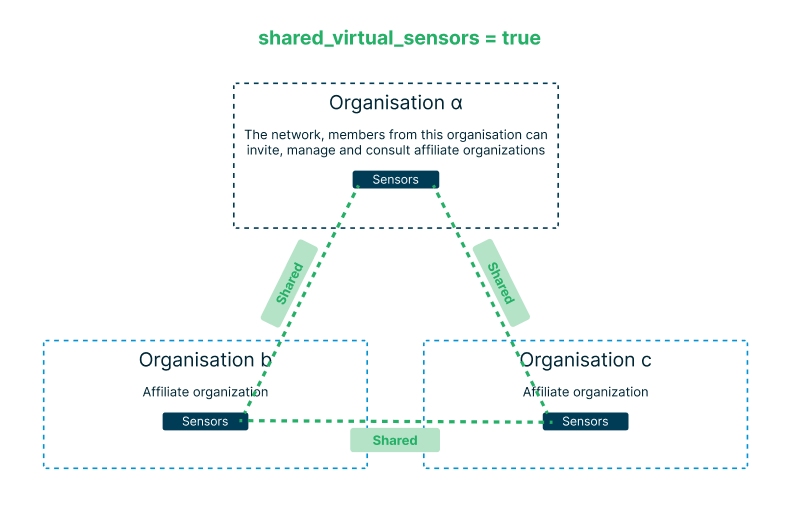
shared_virtual_sensors = true
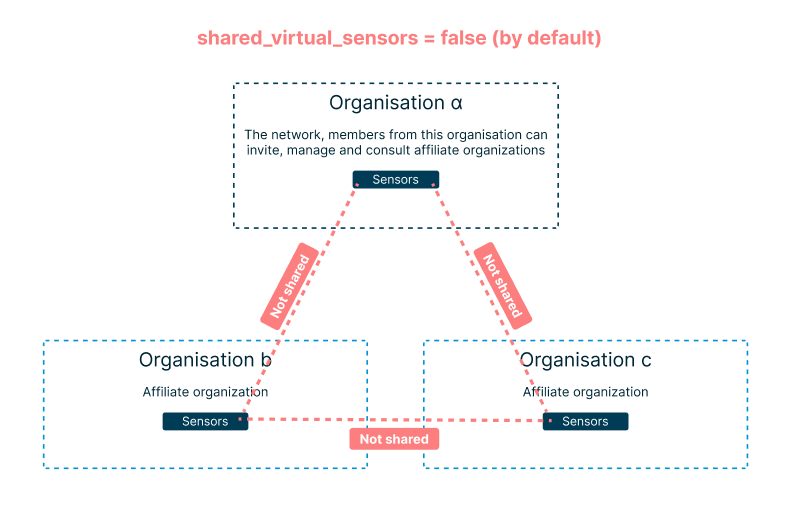
shared_virtual_sensors = false
Members & Roles
Farms are composed of members with the following roles:
owner— always at least one per farmadministratorreaderagentadvisor— extra role on network-level farms, applies to all affiliates
Your role determines the same level of visibility whether you use the Weenat app or the API.
Organization endpoints recap
| Endpoint | Returns |
|---|---|
| v3/organizations/farms | All farms you are a member of |
| v3/organizations/affiliates | All farms affiliated to networks you are a member of |
| v3/organizations/networks | The networks you are a member of |
Geolocation
Sensor and plot positions are represented as [longitude, latitude] coordinates:
"location": [
  -1.539275561720065,
  47.272403197936285
]GeoJSON
You can retrieve plots as GeoJSON files from: /farms, /farms/{id}, /plots, /plots/{id}.
Add the query parameter output_format=geojson. The higher the level, the more plot shapes are included in the response. All plot metadata is in the properties object in the geojson.
Rate Limits & Quotas
To balance shared resources, we enforce the following limits (per user, shared across all his API keys):
Throttling uses a sliding window. Throttled responses are not counted toward the limits.
Data periods for /data endpoints
You cannot retrieve one year of data at raw timespan in one call. But, you can do it in 25 calls.
You can retrieve one year of data at daily timespan in one call.
If you need the raw data, we recommend you store it on your side so you don't have to retrieve them again and it will not decrease a lot your limited number of authorized calls.
If you need to retrieve raw data, we advise you to do it one per day per sensor/plot. That's 1 call for 96 timestamps.
This API is not made for real time.
| Timespan | Max period |
|---|---|
| raw | 15 days |
| hour | 35 days |
| day | 370 days |
Caching recommendations
/v3/plots,/v3/devices— structural data, rarely changes/v3/data/plots/{id},/v3/data/devices/{id}— only changes as the requested time period extends
Frequently Asked Questions
organization_id lets you scope results to a single farm.- Download the YAML file from the Swagger page.
- Create an empty collection in Postman / Insomnia.
- Import the file as a collection.
Become a Partner
Weenat data is already powering integrations across disease risk modelling, irrigation management, arable crop optimisation, and more. These integrations are surfaced directly inside the Weenat app, making it easy for our users to discover and activate them.
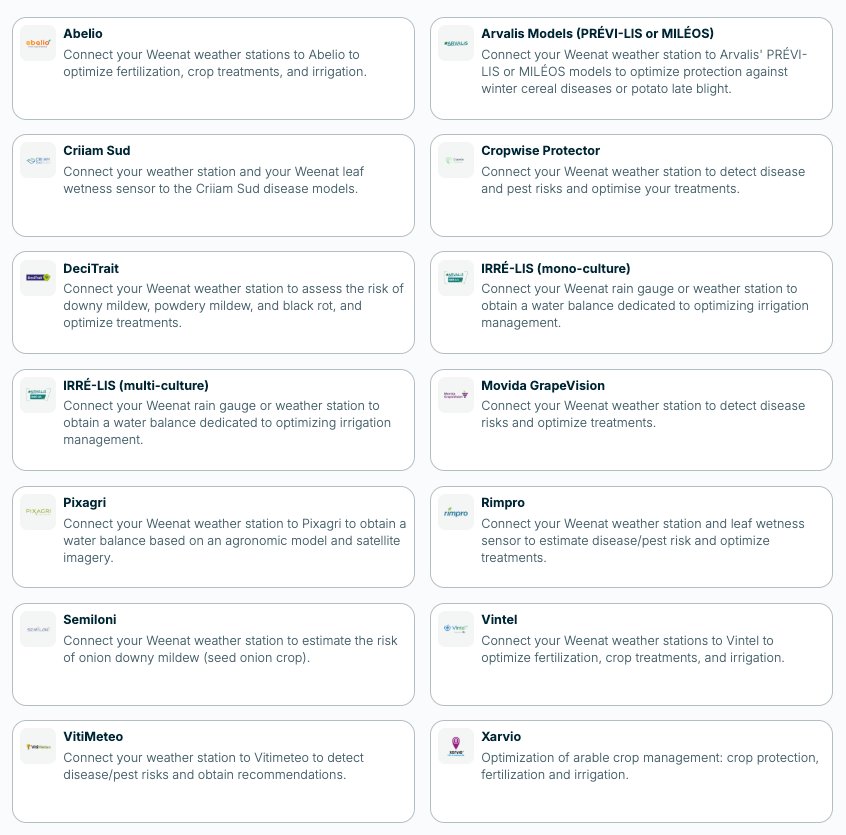
Integrations page — partner listing
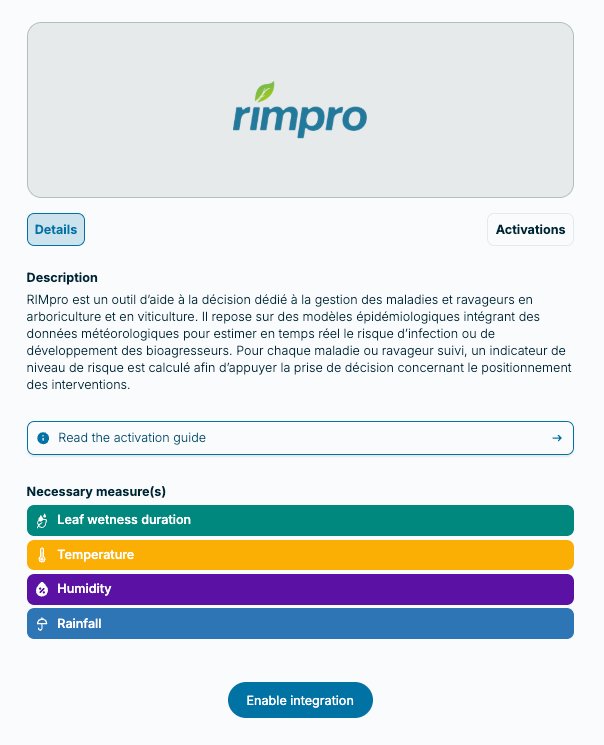
Integration detail & activation
If you are building an integration on top of the Weenat API and would like to be featured in the app's integrations page, we'd love to hear from you. Tell us about your platform, the Weenat data you use, and the value you bring to our mutual users.
Contact us at app@weenat.com