« Developers API V3 Swagger | Developers API V2 »
Developers API V3 - Documentation
Introduction
We are glad to introduce you the Weenat Developers API. We work hard to let you handle your own data the way you want and cover more use cases than the ones you can enjoy in our web and mobile apps.
Who is it made for?
We've made the Weenat Developers API for organizations that dispose of development capacities and can rely on one or more developers.
What are the prerequisites?
In order to use the Weenat Developers API, you will need several elements:
- A Weenat account.
- Be a member of the farms (or networks of farms) whose information you want to retrieve.
- A Weenat Developers API key - Create it here.
Basic principles
-
All calls must be done based on this url:
https://api-prod.weenat.com -
All values must be encoded in
UTF-8. -
Time is represented using ISO 8601 Date & Time Timestamps such as :
2024-12-10T09:04:34Z -
Timestamps are expressed in UTC (Z). Timestamps are not expressed in local time.
-
Main concepts are :
farms,plots,devices,data. There are some specificities among them:farmscan be nested, somedevicesare not related to a plot, not all farms haveplots… and some devices do not exposedata… -
All data is exposed using the
metric system units. Any conversion to imperial system units must be done in your own app. -
Positions of sensors and plots are exposed through
latitudeandlongitudecoordinates. Some old sensors do not provide coordinates. -
Visibility: for a given user, any visible data in the app (desktop or mobile) is visible through the API.
-
If "Meteo Vision (or Spatialized Weather)" service is activated on a plot, its metrics will be exposed in the API.
Calls authentication & API keys
The API relies on API keys for authentication. You can generate an API key in the app.
-
Sign in: https://app.weenat.com/auth/login
-
Go to "My account"
-
Go to "Account management" -> "API"
-
Click on "Create a key", give it a name and save.
If already signed in, go to https://app.weenat.com/me/api
IMPORTANT - All API calls should contain a header Authorization: Weenat-Api-Key <your-api-key>.
API keys are user-based. They are related with your user account, not with the farm(s) you belong to.
This way, whether you are a member of one or more farms (or network of farms), you may need only 1 key to access the data of all the organizations you are related with.
- API keys have no duration limit.
- Once deleted, your key will be immediately uneffective and the service using it will no longer be able to retrieve data.
- You can create up to 20 keys.
What can you do with it?
The most interesting part is to retrieve the data collected by the sensors in your plots. You can scope it to a specific organization (farm or network of farms), a specific plot or a specific sensor.
Each sensor broadcast is a bunch of data which is timestamped. It represents a point in the history of your
data. Here is an example:
{
"timestamp": "2024-12-10T09:04:34Z":
"T": 35.1,
"U": 59.2,
"RR": 0,
"FF": 2.6,
"FXY": 11.3
}
By cumulating the timestamps you can re-create a data table of the measured data. By converting this table into a graph, you can visually represent history. By having the history you can: understand the current situation, make projections…
In order to understand what T, U, RR, FF or FXY may stand for, please refer to the following table that exposes all the measurements you will possibly find in the API responses:
| Key | Definition |
|---|---|
| T | Temperature (°C) |
| U | Relative humidity (%) |
| RR | Cumulative rainfall (mm) |
| FF | Wind speed (km/h) |
| DD | Wind direction (degrees; e.g. 90° for a wind from the east) |
| FXY | Wind gust speed (km/h) |
| T_SOIL-15, T_SOIL-30... | Soil temperature at 15cm, 30cm... (°C) |
| T_CAL-15, T_CAL-30... | Calibration temperature at 15cm, 30cm... (°C) |
| HPOT-15, HPOT-30... | Soil water potential at 15cm, 30cm... (kPa) |
| T_CAPA-15, T_CAPA-30... | Soil temperature at 15cm, 30cm... (°C) |
| U_CAPA-15, U_CAPA-30... | Soil water content at 15cm, 30cm... (%) |
| SF_CAPA-15, SF_CAPA-30,... | Scale frequency at 15cm, 30cm... (no unit) |
| T_DRY | Dry temperature (°C) |
| T_WET | Wet temperature (°C) |
| LW_D | Leaf wetness duration (s) |
| LW_V | Leaf wetness voltage (mV) |
| ECP | Electro-conductivity (dS/m) |
| SWC | Soil water content (%) |
| T_15 | Soil temperature &t 15 cm (°C) |
| SSI | Solar irradiance (W/m²) |
| SSI_MIN | Minimum solar irradiance (W/m²) |
| SSI_MAX | Maximum solar irradiance (W/m²) |
| PPFD | Photosynthetically active radiation (µmol/s/m²) |
| PPFD_MIN | Minimum photosynthetically active radiation (µmol/s/m²) |
| PPFD_MAX | Maximum photosynthetically active radiation (µmol/s/m²) |
| T_DEW | Dew point (°C) |
| ETP | Potential evapotranspiration (mm) |
| READILY_WATER_CONTENT-40, READILY_WATER_CONTENT-50... | Readily available water at 40 cm, 50 cm... (mm) |
| SURVIVAL_WATER_TANK-40, SURVIVAL_WATER_TANK-50... | Survival water tank at 40 cm, 50 cm... (mm) |
| WATER_TANK_LEVEL-40, WATER_TANK_LEVEL-50... | Water tank level at 40 cm, 50 cm... (mm) |
| WATER_TANK_MAX-40, WATER_TANK_MAX-50... | Maximum water tank size at 40 cm, 50 cm... (mm) |
Soil texture types
We use the USDA soil textures classes and expose it in the response of /plots & /plots/{id}. We only expose the id, not the name. So here is a table in order to map it if needed.
| Id | Soil texture |
|---|---|
| 1 | Clay |
| 2 | Silty clay |
| 3 | Fine silty clay |
| 4 | Clayey-sandy |
| 5 | Sandy clay loam |
| 6 | Clay loam |
| 7 | Silt |
| 8 | Fine silt |
| 9 | Loam |
| 10 | Sand |
| 11 | Loamy sand |
| 12 | Sandy loam |
Why are the metrics different from /data/devices/id and /data/plots/id ?
At plot level, we have more information than at device level, such as: soil texture, environment (open field or greenhouse), substrate type (for fertigation probes)...
One of the most required metric is U_CAPA at device level. However, we cannot provide this information at device level as in our data model a sensor can be related to more than one plot and each plot can have a different soil texture (calibration equation selector in the plot context panel).
By default, the calibration equation value is "By default". You can map this value with the value "Generic" in the tables below. Otherwise, it is a direct mapping.
U_CAPA is calculable from SF_CAPA which we expose at device level.
Also, we manufacture sensors with two different brands of capacitance probes: HSTI (exposed as "HydrWize") & Aquacheck (exposed as "AquaChck"). And each one has different calibration equations.
Therefore, in order to let API users calculate U_CAPA from SF_CAPA, here are the information you may need:
Equation
Y = α + β * x
With Y = soil water content (U_CAPA, the value you want to obtain) and x = SF_CAPA (the value we expose in the /data/devices/id response.
For HSTI Capacitance probes (HydrWize)
| Calibration equations | α | β |
|---|---|---|
| Sand | -10.836 | 0.4853 |
| Sandy loam or Loamy sand | 11.107 | 0.2072 |
| Sandy clay loam | 9.2507 | 0.21885 |
| Sandy clay | 7.3944 | 0.2305 |
| Clay or Silty clay or Clay loam or Silty clay loam | -14.891 | 0.5052 |
| Loam or Silt or Silt loam | -1.892 | 0.3562 |
| Generic (all other calibration equations) | 3.4664 | 0.2689 |
For Aquacheck Capacitance probes (AquaChck)
| Calibration equations | α | β |
|---|---|---|
| Sand | -8.6463 | 0.5219 |
| Clay | -5.9575 | 0.6193 |
| Silt loam | -2.79 | 0.4392 |
| Loam | 4.8372 | 0.4851 |
| Clay loam | -8.4439 | 0.565 |
| Generic (all other calibration equations) | -7.4347 | 0.5564 |
Fetch probe brand from /plots response and apply the right α & β values in order to calculte U_CAPA from the SF_CAPA values you will get from /data/devices/id response.
Measurements & sensor broadcast timespans
Measurements can have different broadcast timespans. The majority of Weenat sensors emit every 15 minuntes. However, the broadcast frequency of the Frost sensor goes from 15, to 11, to 5 minutes depending on how fast the temperature is getting closer to 0°C. Soil capacitance probes emit every 30 minutes.
| Sensor | Broadcast timespan |
|---|---|
| All sensors | 15 minutes |
| Frost sensors | 15, 11 or 5 minutes |
| Soil capacitance probes | 30 minutes |
The lowest timespans (highest frequencies) will be available only through: /data/devices/{id}
but not through /data/plots/{id} which will expose hourly timespans minimum.
Plots can aggregate several sensors and sensors broadcast timespans may differ from one another, therefore exposing measurements of different timespans would be challenging, especially as sensors don't broadcast synchronously.
Sensor model names and correspondance
In order to let you understand what is a CHP-30/60 sensor, here is a correspondance table:
| Model name | Sensor type |
|---|---|
| CAPA-30-3 | Soil capacitance probe |
| CAPA 60-6 | Soil capacitance probe |
| CAPA-60-6 | Soil capacitance probe |
| CHP | Tensiometer |
| CHP-10 | Tensiometer |
| CHP-15/30 | Tensiometer |
| CHP-20 | Tensiometer |
| CHP-30/60 | Tensiometer |
| CHP-60/90 | Tensiometer |
| CHP-90 | Tensiometer |
| CIMPOD15 5.00A | CIMPOD15 5.00A |
| Davis | Davis |
| Détruit | Destroyed sensor |
| EC | Fertigation probe |
| HP | Tensiometer |
| HP60 | Tensiometer |
| LWS | Leaf wetness sensor |
| LWS+ | Leaf wetness sensor |
| Mini-T | Soil thermometer |
| P | Pluviometer |
| P+ | Weather station |
| PAR | Photosynthetically active radiation sensor |
| PCB 2.504 | PCB 2.504 |
| Pessl | Pessl |
| P+ IN simple | Pluviometer |
| PT | Weather station |
| PYRANO | Pyranometer |
| T | Soil thermometer |
| T10 | Soil thermometer |
| T15 | Soil thermometer |
| T5CHP30 | Tensiometer |
| T5CHP30+ | Tensiometer |
| T5CHP60 | Tensiometer |
| T5CHP60+ | Tensiometer |
| T5HP30 | Tensiometer |
| T5HP60 | Tensiometer |
| TCHP | Tensiometer |
| TCHP+ | Tensiometer |
| TCHP20 | Tensiometer |
| T_GEL | Frost sensor |
| TH | Thermometer & Hygrometer |
| THP35 | Thermometer & Hygrometer |
| T_MINI | Soil thermometer |
| TSA | Frost sensor |
| VM | Anemometer |
| VM+ | Anemometer |
| VU+ | Anemometer & Weather station |
| W | Anemometer |
| W+ | Anemometer |
| Aqualink-CAPA-10-1 | CoRHIZE Aqualink Soil capacitance probe |
| Aqualink-CAPA-20-2 | CoRHIZE Aqualink Soil capacitance probe |
| Aqualink-CAPA-30-3 | CoRHIZE Aqualink Soil capacitance probe |
| Aqualink-CAPA-40-4 | CoRHIZE Aqualink Soil capacitance probe |
| Aqualink-CAPA-50-5 | CoRHIZE Aqualink Soil capacitance probe |
| Aqualink-CAPA-60-6 | CoRHIZE Aqualink Soil capacitance probe |
| Aqualink-CAPA-70-7 | CoRHIZE Aqualink Soil capacitance probe |
| Aqualink-CAPA-80-8 | CoRHIZE Aqualink Soil capacitance probe |
| Aqualink-CAPA-90-9 | CoRHIZE Aqualink Soil capacitance probe |
| Aqualink-CAPA-100-10 | CoRHIZE Aqualink Soil capacitance probe |
| Aqualink-CAPA-110-11 | CoRHIZE Aqualink Soil capacitance probe |
| Aqualink-CAPA-120-12 | CoRHIZE Aqualink Soil capacitance probe |
| Aqualink-CAPA-140-14 | CoRHIZE Aqualink Soil capacitance probe |
| Corpus-CAPA-20-2 | CoRHIZE EVVOS Soil capacitance probe |
| Corpus-CAPA-30-3 | CoRHIZE EVVOS Soil capacitance probe |
| Corpus-CAPA-40-4 | CoRHIZE EVVOS Soil capacitance probe |
| Corpus-CAPA-60-6 | CoRHIZE EVVOS Soil capacitance probe |
| Corpus-CAPA-80-8 | CoRHIZE EVVOS Soil capacitance probe |
| Corpus-WS | CoRHIZE EVVOS Weather Station |
| Corpus-WS-CAPA-40-4 | CoRHIZE EVVOS Weather Station & Soil capacitance probe |
| Corpus-WS-CAPA-50-5 | CoRHIZE EVVOS Weather Station & Soil capacitance probe |
| Corpus-WS-CAPA-60-6 | CoRHIZE EVVOS Weather Station & Soil capacitance probe |
| Corpus-WS-CAPA-80-8 | CoRHIZE EVVOS Weather Station & Soil capacitance probe |
Both name and type will be exposed in the API responses.
Leaf Wetness Intensity (LW_I)
Leaf Wetness intensity is calculated from the Leaf Wetness voltage. Depending on its voltage, the value of the intensity changes.
| LW_V (mV) | LW_I value |
|---|---|
| [0 - 362] | 0 |
| [362 - 416] | 1 |
| [416 - 470] | 2 |
| [470 - 525] | 3 |
| [525 - 579] | 4 |
| [579 - 633] | 5 |
| [633 - 687] | 6 |
| [687 - 742] | 7 |
| [742 - 796] | 8 |
| [796 - 850] | 9 |
| [850 - 1000] | 10 |
Data model representation
In order to let you understand how the data is structured at Weenat here is a simple schema:
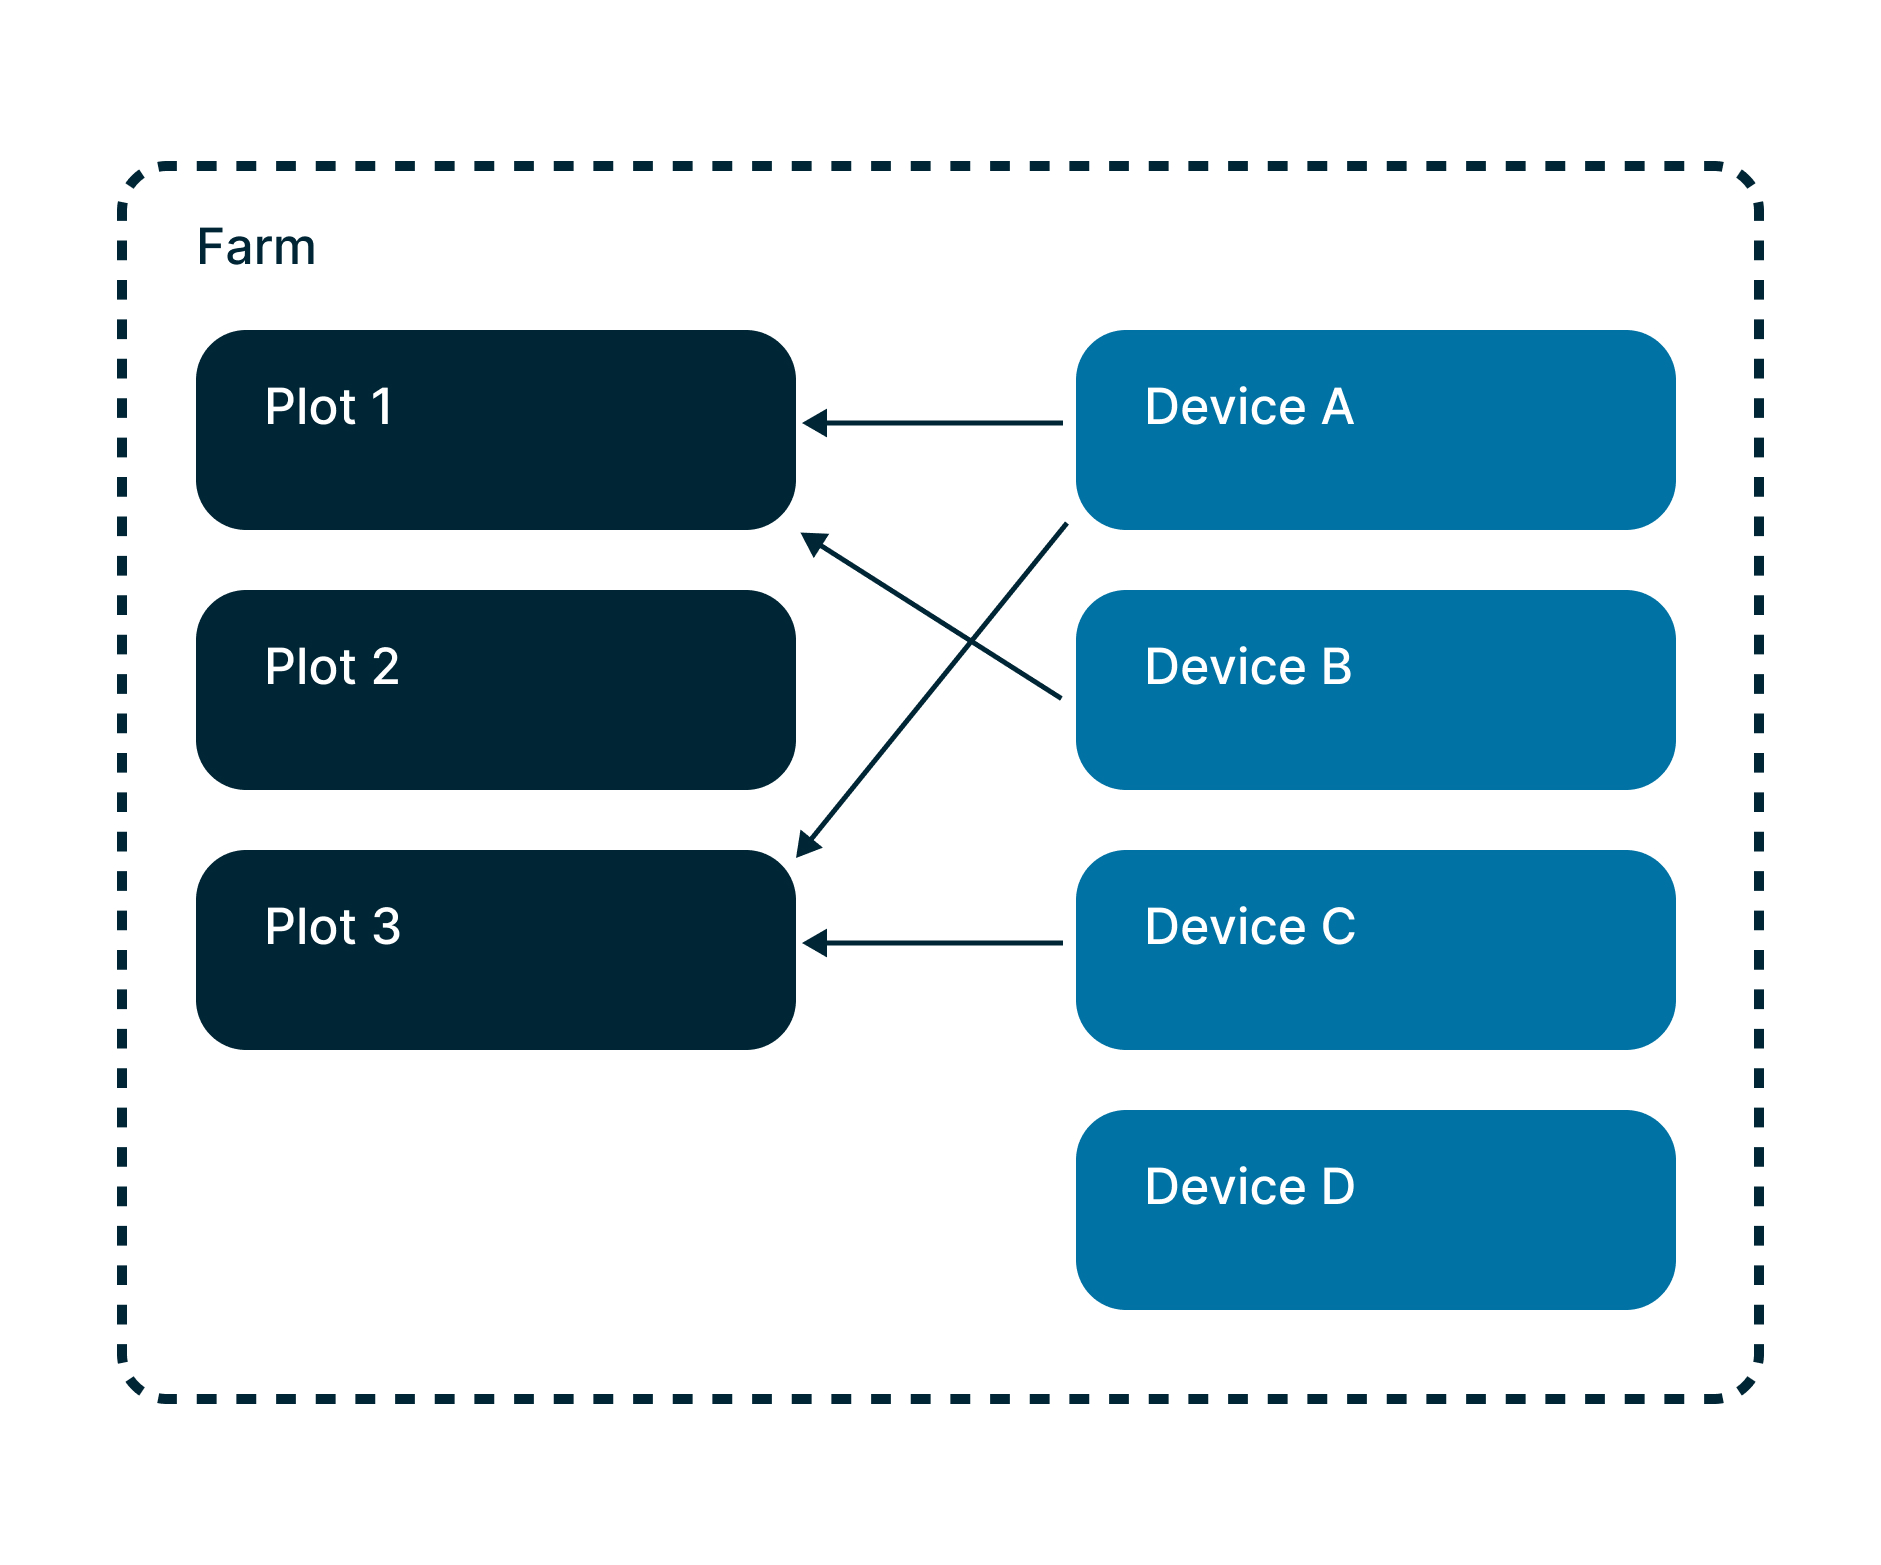
The ultimate level of data container is a farm. A farm contains zero, one or several
plots.
A device is a sensor. It is related with one, several or no plot at all.
Depending on its type, each device transmits a dataset which can differ in structure and timespan. A frost sensor broadcasts temperatures and a pluviometer broadcasts rainfall quantity.
"Spatialized weather" data is exposed at plot level as it does not stand as a "real" sensor but comes from calculation.
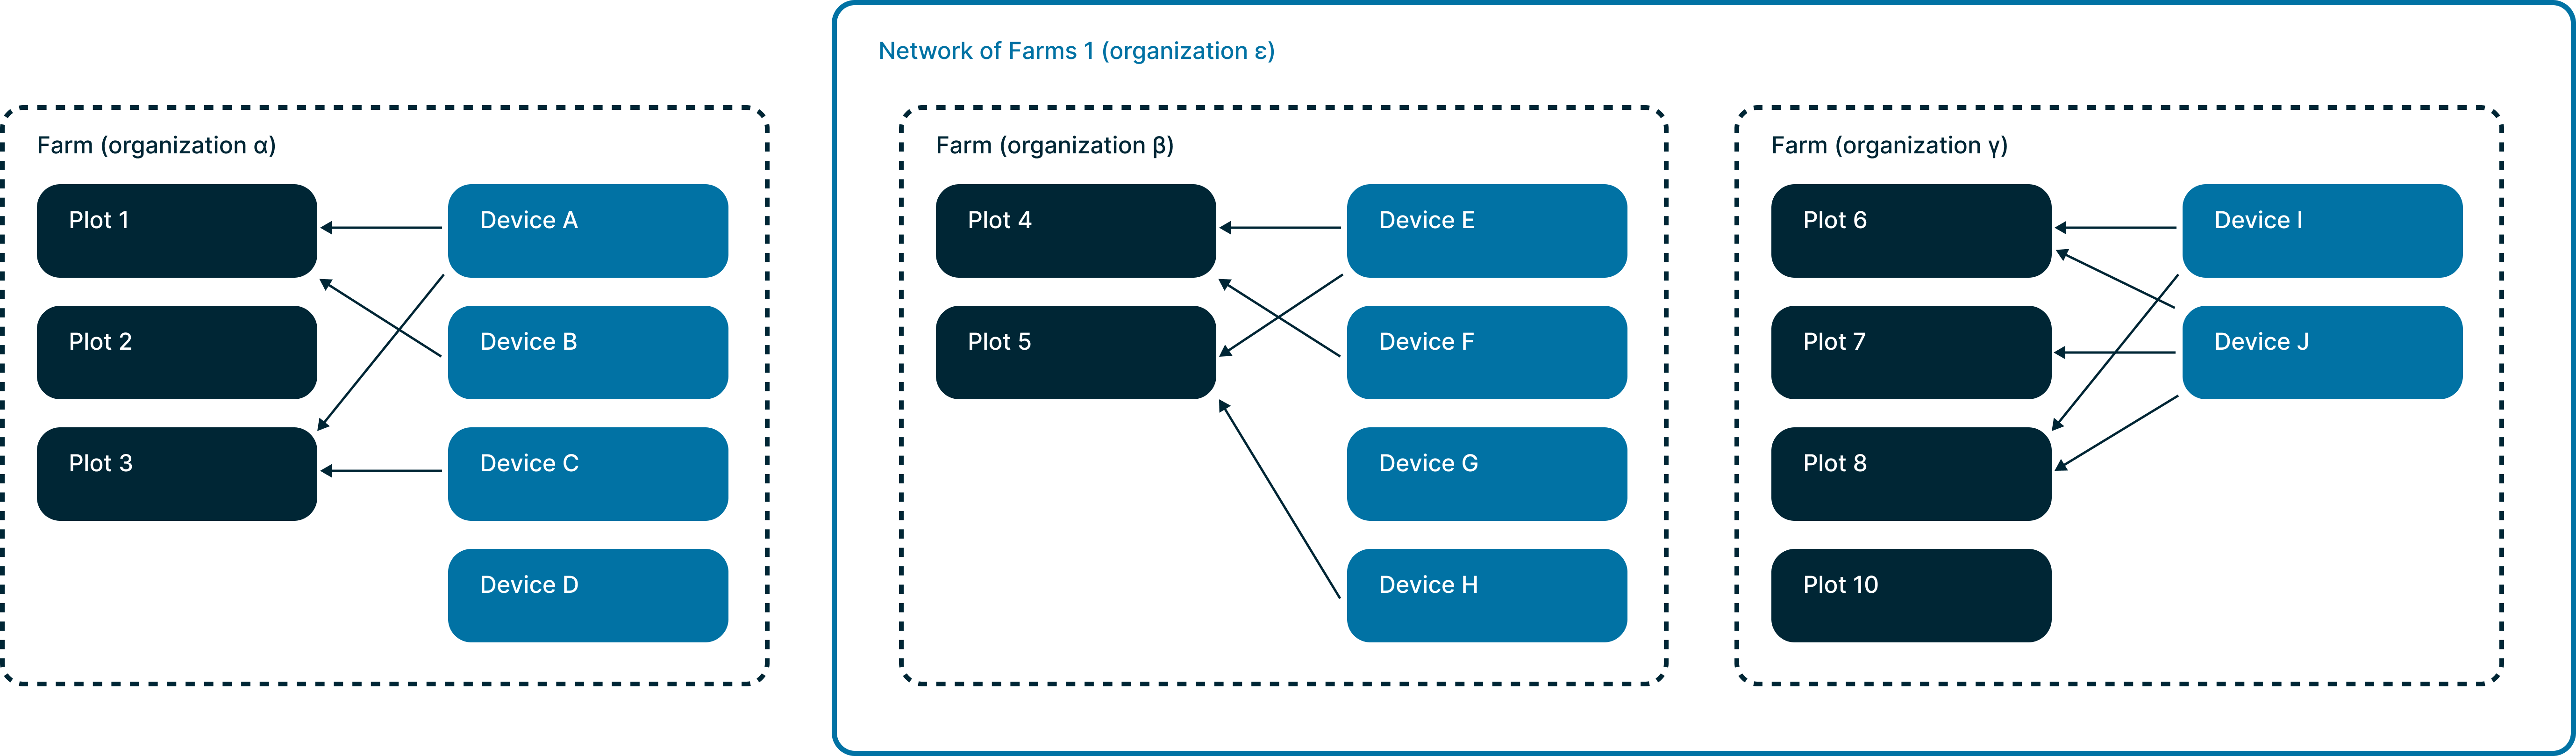
Networks & Affiliates
A farm or a network of farms are both organizations in Weenat's database.
However, a network of farms can include several farms.
A farm network is commonly named a network and all of the farms related to it are named
affiliates.
Members & Roles
Farms are composed of members.
Members can have different roles: owner, administrator, reader or
agent.
A farm always have at least one owner.
A farm, which happens to be also a network of farms, has all these roles plus an extra role that applies on all of
the affiliate farms of the network: advisor.
Being a member of a farm, which happens to be a network of farms, lets you retrieve the data coming from all the farms of the network whereas being a member of one farm only lets you retrieve the data only from this specific farm.
Depending on your role and if it stands on the shoulders of a farm or a network of farms, you will have the same level of visibility over data whether you are using the Weenat app or the Weenat API.
A farm can be affiliated with more than one single network (very rare).
Recap
By calling the v3/organizations/farms, you will get a list of all the farms you're a member of.
By calling the v3/organizations/affiliates, you will get a list of all the farms which are affiliates of
the networks you're a member of.
By calling the v3/organizations/networks, you will get a list (most of the time only 1 record) of the
farm networks from which, the farm you're a member of, is an affiliate.
Geolocation
-
Geolocations of
sensorsorplots(center of the plot) have a position on the globe. Their coordinates are represented like this:
"location": [
-1.539275561720065,
47.272403197936285
]
Geojson
You can retrieve plots in Geojson files.
Whether on the /plots, /plots/{id}, /farms or /farms/{id} endpoints.
Depending on the level you request the file, you will get more or less plots shapes in your geojson file.
In order to retrieve this format, add the output_format=geojson query param and value.
All the plot metadata is in the properties object.
Is there any limitation?
Quotas
In order to balance shared resources between all API users, we currently enforce the following rate limits:
- 200 API calls per minute
- 4,000 API calls per day
Quotas are per user. Even if a user can have up to 20 API keys, the quotas are divided among one user's keys.
We have two throttles: "burst": "200/minute" & "sustained": "4,000/day".
This throttles store all the latest calls during these two periods, and if the count exceeds its respective limit, it throttles with a calculation based on the date of the next call that will be issued (sliding window).
Throttled responses are not counted.
Periods for /data endpoints
Depending on the defined timespan value provided, the maximum period duration is as follows:
- raw: 15 days
- hour: 35 days
- day: 370 days
Caching recommendations
In order to remain below these limits, we advise you to cache the responses, especially the ones from
/v3/plots or /v3/devices which do not change frequently and the ones from
/v3/data/plots/{id} or /v3/data/devices/{id} which only change if you
extend the requested period as time goes by.
Frequently Asked Questions
What about a weather station that is no longer related to a plot?
What if I want to scope the results only to aspecific type of sensors?
Are "Meteo Vision" virtual devices exposed in the response?
Is the organization_id parameter required?
Do you have a Postman collection? an Insomnia collection?
-
Download the file
-
Create an empty collection in Postman / Insomnia
-
Import this file as a collection